Kodeclik Blog
Recognizing proportional relationships
A proportional relationship exists between two quantities when they vary directly with each other, maintaining a constant ratio. When one quantity increases or decreases, the other changes by the same factor, resulting in a consistent relationship.
Definition of a proportional relationship
The relationship can be expressed as y=kx, where k is referred to as the constant of proportionality.
Example 1: Gallons of Gas
Assuming a gallon of gas costs $3/gallon, 10 gallons costs $30, and 6 gallons costs $18. This is a proportional relationship where y = cost and x = number of gallons, and the constant of proportionality is 3 (in units of dollars/gallon).
Example 2: Walking Distance and Time
Assuming we walk at 3.5 miles per hour (a constant speed), the distance walked is a proportional relationship that depends on the amount of time, ie d = 3.5t. Thus, for 2 hours we will walk 2*3.5= 7 miles, and for 3 hours we would have walked a distance of 3*3.5= 10.5 miles.
Example 3: Cooking Recipes
An original recipe to make 8 pancakes recommends to use 1½ cups of flour. Thus if p = number of pancakes and f = number of cups of flour, the constant of proportionality is 8*⅔ = 16/3 pancakes/cup. If we use 3 cups of flour, we would make 16/3 * 3 = 16 pancakes.
Example 4: Assist to Turnover Ratio in Basketball
In basketball, this ratio measures a player's ball control efficiency by comparing assists (passes leading to points) to turnovers (losing possession). This is essentially the constant of proportionality when you divide total assists by total turnovers. If a player has 200 assists and 100 turnovers, their ratio would be: 200/100 = 2.00. This means they generate 2 assists for every turnover they commit.
The Indiana Pacers led NBA teams with an assist-to-turnover ratio of 2.403, followed by the Denver Nuggets at 2.300 and the Boston Celtics at 2.220.
The important thing to note about proportional relationships is that both quantities increase or decrease together but the ratio between the quantities remains constant.
Proportional relationships graphed
When graphed, a proportional relationship always forms a straight line that passes through the origin (0,0).
Let us take each of the above relationships and plot them using Desmos:
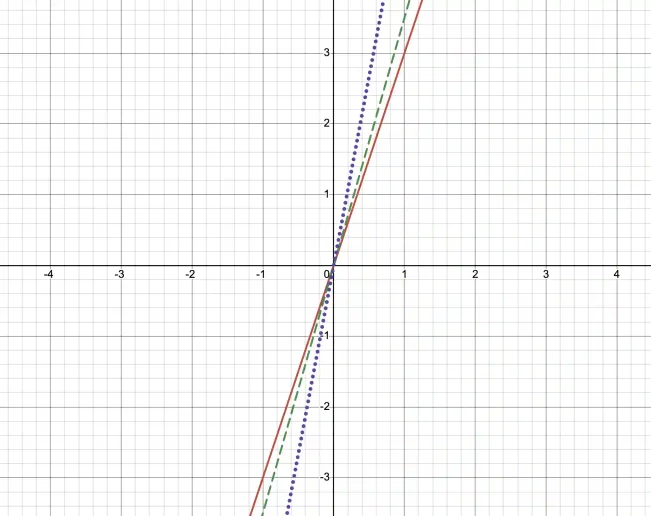
As you can see all of them are lines that pass through the origin and the only difference between these relationships is the slope. The slope is basically the constant of proportionality!
Thus, to identify a proportional relationship on a coordinate plane, look for a graph that is a straight line and passes through the origin (0, 0); if the line is not straight or does not pass through the origin, the relationship is not proportional.
Checking if data displayed in a table shows a proportional relationship
Here’s some data given in the form of a table. To keep the mystery the identity of what “x” and what “y” means is kept a secret.
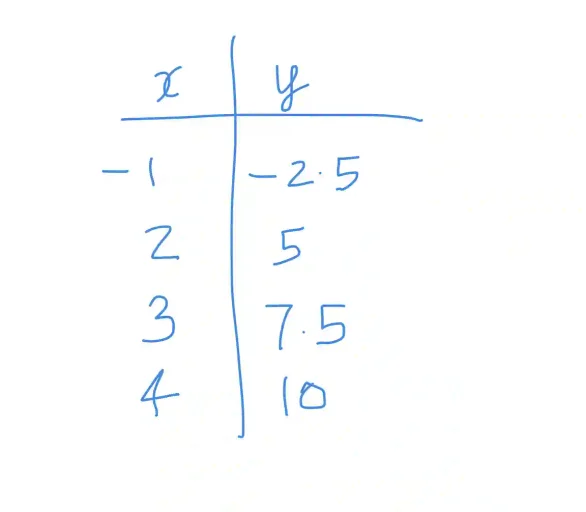
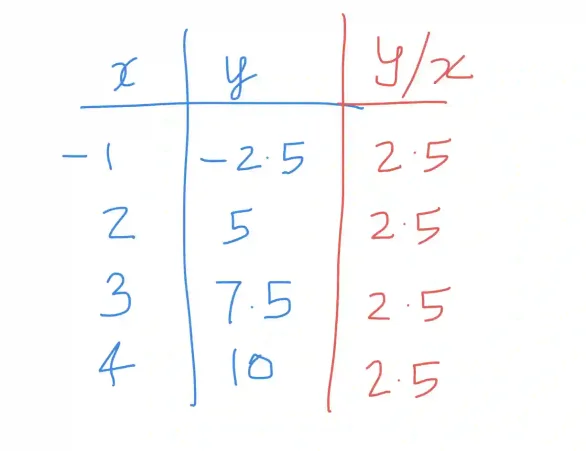
The easiest way to check is to divide y by x and see if it is constant throughout. In this case it is!
Checking if data displayed in the coordinate plane shows a proportional relationship
Here we are given data in the form of points on the (x,y) coordinate plane.
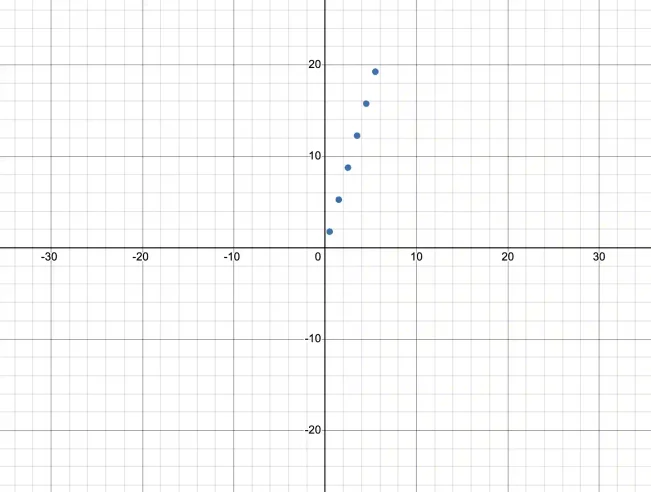
To determine if a proportional relationhip exists just look for the data to lie on a straight line passing through the origin. In this case they do! The line is basically y=3.5x as shown below:
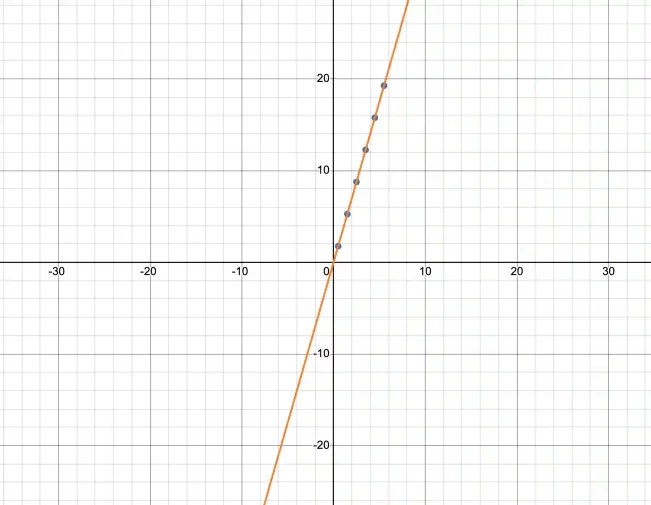
Keep i mind that if the x and y coordinates form proportional relationships, then there is some fixed number (a constant) that when multiplied with x will yield y.
Exercise 1: Does the below table constitute a proportional relationship?
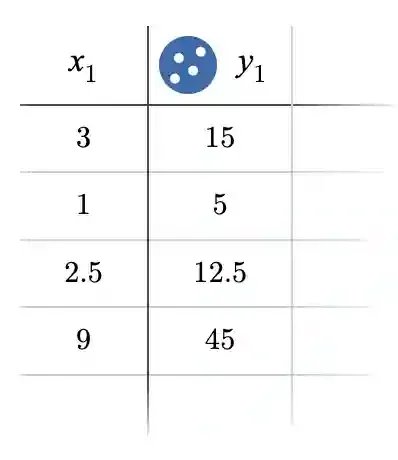
Note that we have deliberately not listed the rows in order of increasing x.
All you need to do is to find y/x for each row like so:
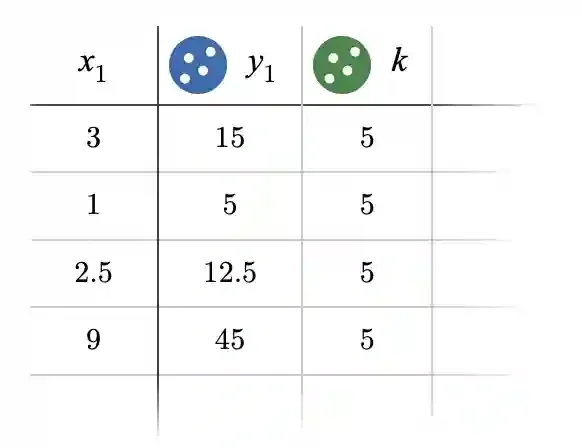
As you can see the constant is the same across rows and thus the table constitutes a proportional relationship.
Exercise 2: What is the constant of proportionality between the radius and the circumference of a circle?
The relationship between radius (r) and circumference (C) of a circle is expressed by the formula C = 2πr. In this equation, 2π is the constant of proportionality (k), meaning: When radius doubles, circumference doubles, and when radius triples, circumference triples.
Exercise 3: Is the relationship between radius and area of a circle a proportional relationship?
The area (A) of a circle is related to its radius (r) by the formula: A=πr². This is not a proportional relationship because the radius is squared (r²). A proportional relationship must be linear (y = kx). Here, when radius doubles, the area quadruples. Similarly, when radius triples, the area increases by a factor of 9. Thus the relationship between radius and area of a circle is not proportional - it is quadratic.
In summary, only linear relationships that pass through the origin (0,0) can be proportional. This is a key defining characteristic of proportional relationships.
In summary, note that:
The reason for these restrictions is that proportional relationships must maintain a constant ratio between the two variables. Only linear relationships through the origin maintain this constant ratio, where y/x = k for all values of x and y.