Kodeclik Blog
6 Industries that use Python
Python is a very versatile language. Not only is the language design clean and simple, it now features a whole range of libraries that others have built that you can import in your programs to create very expressive applications! These libraries are now an inevitable part of the Python ecosystem and undoubtedly what makes it successful and popular.
The Python language was conceived in the late 1980s by Dutch programmer Guido van Rossum. Van Rossum began working on Python in December 1989 at the Centrum Wiskunde & Informatica (CWI) in the Netherlands as a successor to the ABC programming language Did you know Van Rossum named Python after the British comedy series "Monty Python's Flying Circus," as he was a fan of the show!
As we mentioned above, Python's development has been guided by a strong community. van Rossum served as the "Benevolent Dictator for Life" (BDFL) until 2018, when he stepped down from this role. The language is now overseen by the Python Software Foundation and a steering council.
Here are 6 industries that use Python extensively.
1. Web Development
Python can be used for server-side web development, handling tasks such as receiving and processing HTTP requests and responses, implementing business logic, and generating dynamic HTML content that will be displayed on the user’s browser. Its simplicity and readability make it an excellent choice for rapid development, while its scalability allows it to handle high-traffic web applications.
A classical web development framework in Python is Flask. Here is a basic Flask application:
from flask import Flask

app = Flask(__name__)

@app.route('/')
def hello_world():
    return 'Hello, World!'

if __name__ == '__main__':
    app.run()
The above code creates a basic Flask application. The line @app.route('/') is a decorator that tells Flask what URL should trigger our function. In this case, the root URL ('/') is associated with the following function, namely the hello_world() function which simply prints “Hello, World!”. When you run this script, it will start a web server on your local machine. If you open a web browser and go to http://localhost:5000 (5000 is the default port for Flask), you'll see the text "Hello, World!" displayed.
Of course this is a very simple example but you get the idea. You can add more complex functionality to create a more complex web server. In fact, Django is a full-stack framework built in Python that follows the Model-View-Controller (MVC) pattern and provides a comprehensive set of tools for building complex web applications.
You can use Flask for simple web applications and Django is recommended for a more comprehensive framework for larger projects.
2. Data analysis
Python has become a powerhouse for data analysis due to its simplicity, versatility, and robust ecosystem of libraries. It's widely used in any area that deals with massive volumes of data, such as finance, business, biology, and social sciences. You can use Python for loading and cleaning data, exploratory data analysis, statistical modeling, and visualization of patterns.
Some of the popular Python libraries for data analysis are numpy, pandas, and matplotlib. Numpy is essentially a library for working large, multi-dimensional arrays and matrices. Pandas offers data structures and operations for manipulating numerical tables and time series. Finally, matplotlib is a plotting library for creating static, animated, and interactive visualizations.
Consider the below program:
import pandas as pd

# Create a DataFrame
df = pd.DataFrame({
    'Name': ['Alice', 'Bob', 'Charlie'],
    'Age': [25, 30, 35],
    'City': ['New York', 'Paris', 'London']
})

# Display the DataFrame
print(df)

# Calculate basic statistics
print(df['Age'].describe())

# Filter data
print(df[df['Age'] > 28])
Note that it imports the Pandas library (as “pd”) and creates a DataFrame, which is a two-dimensional labeled data structure. Think of a DataFrame as a table or a spreadsheet.
The output of the above program will be:
      Name  Age      City
0    Alice   25  New York
1      Bob   30     Paris
2  Charlie   35    London
count     3.0
mean     30.0
std       5.0
min      25.0
25%      27.5
50%      30.0
75%      32.5
max      35.0
Name: Age, dtype: float64
      Name  Age    City
1      Bob   30   Paris
2  Charlie   35  London
The DataFrame is initialized with three columns: 'Name', 'Age', and 'City', containing information for three individuals. The program then displays the entire DataFrame, showing all the data in a tabular format. Next, it calculates and prints basic statistical information about the 'Age' column using the describe() function, which provides metrics such as count, mean, standard deviation, minimum, and maximum values. Note that in just one line of code we obtain so much information about the dataset! This is what makes libraries such as pandas indispensable to data analysts!
Finally, the program filters the DataFrame to show only the rows where the 'Age' is greater than 28, demonstrating how to select specific data based on conditions. Here we can see that only two rows are printed (as opposed to the original three in the dataframe).
This simple example showcases Pandas' ability to create, display, analyze, and filter structured data efficiently, which are fundamental operations in data analysis and manipulation.
Here is an example of using Python and the matplotlib library for graphing:
import matplotlib.pyplot as plt
import numpy as np

# Generate data
x = np.linspace(0, 10, 100)
y = np.sin(x)

# Create a line plot
plt.plot(x, y)
plt.title('Sine Wave')
plt.xlabel('x')
plt.ylabel('sin(x)')
plt.show()
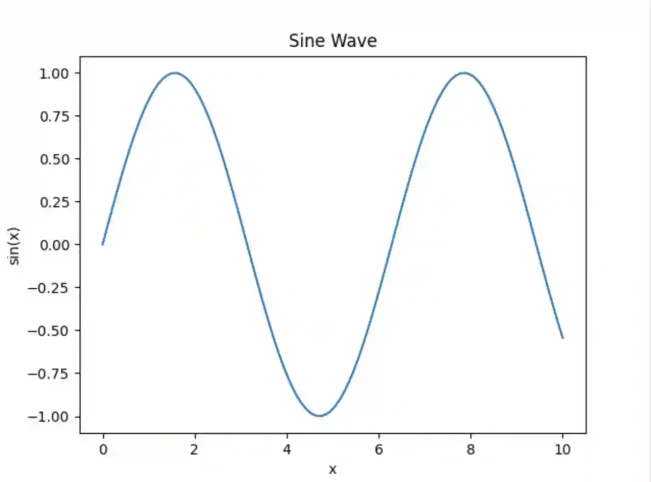
The above Python code creates a visual representation of a sine wave using the Matplotlib and NumPy libraries. Using numpy, it generates a series of 100 evenly spaced points along the x-axis from 0 to 10, then calculates the corresponding sine values for each point. These data points are then plotted using matplotlib as a continuous line, resulting in the characteristic oscillating curve of a sine wave.
The output is:

3. Machine learning and AI
Python has become the de facto language for machine learning and AI due to its simplicity, versatility, and extensive ecosystem of libraries. It's widely used for various machine learning tasks, including data preprocessing, model training, evaluation, and deployment.
Besides numpy and pandas, key Python libraries for ML include scikit-learn, tensorflow, PyTorch, and Keras. TensorFlow (from Google) and PyTorch (from Facebook/Meta) are often considered the two leading frameworks for deep learning, with PyTorch being more popular and adopted. scikit-learn remains the go-to library for traditional machine learning tasks, as we show next.
Here's a simple example using scikit-learn that demonstrates linear regression to model the relationship between height and weight. Linear regression can be viewed as the “Hello World” of machine learning, ie the simplest possible model (sometimes considered so simple relative to more advanced AI and ML methods)
import numpy as np
import pandas as pd
import matplotlib.pyplot as plt
from sklearn.linear_model import LinearRegression
from sklearn.model_selection import train_test_split

# Generate sample data
np.random.seed(42)
height = np.random.normal(170, 10, 100)  # keeping mean around 170 cm
weight = height * 0.5 + np.random.normal(0, 5, 100)  # reducing noise in the weight data


# Create a DataFrame
df = pd.DataFrame({'Height': height, 'Weight': weight})

# Split the data into training and testing sets
X_train, X_test, y_train, y_test = train_test_split(
    df[['Height']], df['Weight'], test_size=0.2, random_state=42)

# Create and train the model
model = LinearRegression()
model.fit(X_train, y_train)

# Make predictions
y_pred = model.predict(X_test)

# Create a scatter plot of the data
plt.figure(figsize=(10, 6))
plt.scatter(X_test, y_test, color='blue', alpha=0.5, label='Actual data')
plt.plot(X_test, y_pred, color='red', label='Regression line')

plt.title('Height vs Weight: Linear Regression')
plt.xlabel('Height (cm)')
plt.ylabel('Weight (kg)')
plt.legend()

# Add the equation of the line
equation = f'y = {model.coef_[0]:.2f}x + {model.intercept_:.2f}'
plt.text(160, 120, equation, fontsize=12)

plt.show()

# Print the model's performance
print(f"R-squared score: {model.score(X_test, y_test):.2f}")
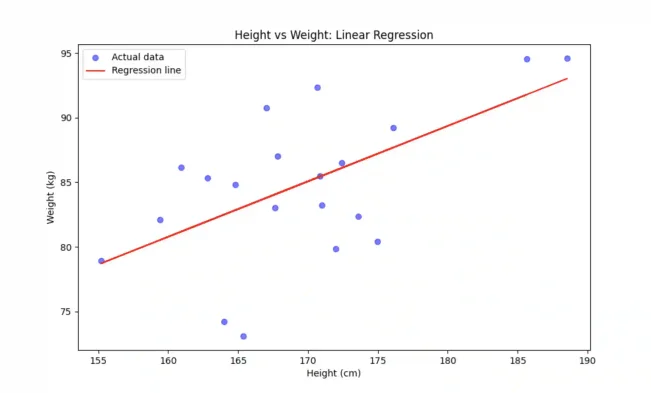
The above code demonstrates a simple linear regression analysis using Python. It generates synthetic height and weight data, creates a linear regression model to predict weight based on height, and visualizes the results. You can see that it uses popular data science libraries like NumPy, Pandas, Matplotlib, and Scikit-learn to perform data manipulation, model training, and visualization. It splits the data into training and testing sets, fits a linear regression model, makes predictions, and then creates a scatter plot of the actual data points along with the regression line.
The resulting graph looks like:

Your figure will look different due to the randomness of data generated. Note that the blue dots are the data that was given to the model and the red line is the “best fit”. Obviously there will be no single line that goes through all the given points and the algorithm has determined the line where the deviations from it (to the given points) are as small as possible.
We can notice that there is an approximately monotonic relationship between height and weight. As height increases, so does weight (with some variation and scatter).
4. Finance
Python has become increasingly popular in the finance industry due to its versatility, ease of use, and powerful libraries for data analysis and quantitative finance. It's used for a wide range of financial applications, including quantitative analysis, algorithmic trading, and portfolio optimization.
One of the common finance libraries for finance is yfinance using which we can downloading financial data from Yahoo Finance (hence the name!) and then use it for analysis. There are also libraries such as pyfolio (for portfolio and risk analytics), quantlib (for quantitative finance), and zipline (for backtesting trading algorithms).
Here is a simple Python program that uses yfinance:
import yfinance as yf
import pandas as pd
import matplotlib.pyplot as plt
from datetime import datetime, timedelta

# Download stock data
def get_stock_data(ticker, start_date, end_date):
    stock = yf.Ticker(ticker)
    data = stock.history(start=start_date, end=end_date)
    return data

# Calculate moving averages
def calculate_moving_averages(data, short_window, long_window):
    data['SMA_short'] = data['Close'].rolling(window=short_window).mean()
    data['SMA_long'] = data['Close'].rolling(window=long_window).mean()
    return data

# Plot stock price and moving averages
def plot_stock_data(data, ticker):
    plt.figure(figsize=(12, 6))
    plt.plot(data.index, data['Close'], label='Close Price')
    plt.plot(data.index, data['SMA_short'], label='50-day SMA')
    plt.plot(data.index, data['SMA_long'], label='200-day SMA')
    plt.title(f'{ticker} Stock Price and Moving Averages')
    plt.xlabel('Date')
    plt.ylabel('Price')
    plt.legend()
    plt.show()

# Main execution
if __name__ == "__main__":
    ticker = "AAPL"
    end_date = datetime.now()
    start_date = end_date - timedelta(days=365*2)  # 2 years of data

    stock_data = get_stock_data(ticker, start_date, end_date)
    stock_data = calculate_moving_averages(stock_data, 50, 200)
    plot_stock_data(stock_data, ticker)

    # Calculate and print returns
    returns = stock_data['Close'].pct_change()
    annual_return = returns.mean() * 252  # Assuming 252 trading days in a year
    print(f"Annual Return: {annual_return:.2%}")

    # Calculate and print volatility
    volatility = returns.std() * (252 ** 0.5)  # Annualized volatility
    print(f"Annualized Volatility: {volatility:.2%}")
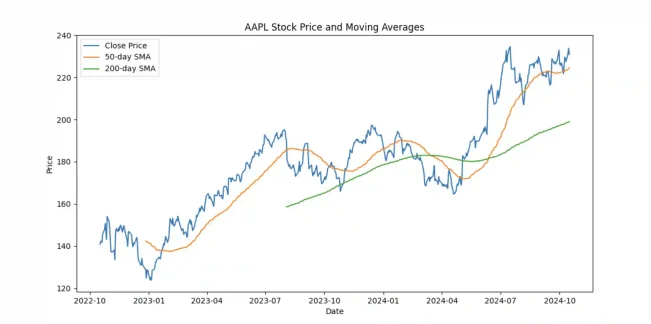
The above code downloads stock data for Apple (AAPL) for the last two years using the yfinance library, calculates 50-day and 200-day simple moving averages, plots the stock price with these averages, and finally calculates and prints the annual return and annualized volatility.
The output will be:

This is just a simple example, but it illustrates how Python can be used to perform financial analysis tasks efficiently. More complex applications might involve portfolio optimization, risk modeling, or implementing trading strategies.
5. Cybersecurity
Not surprisingly, Python is widely used in cybersecurity again due to the extensive library ecosystem for this domain. For example, Python is used for automated security testing and penetration testing, network scanning, malware analysis, log analysis, intrusion detection, and in general automating and developing custom security tools.
Key Python libraries for cybersecurity include Scapy (for packet manipulation and network scanning), Nmap (for network discovery and auditing), and Yara (for malware identification and classification).
Here's a simple example using the Scapy library to perform a TCP SYN scan:
from scapy.all import *

def syn_scan(target, port):
    # Create a SYN packet
    syn_packet = IP(dst=target)/TCP(dport=port, flags="S")

    # Send the packet and wait for a response
    response = sr1(syn_packet, timeout=1, verbose=0)

    if response is None:
        print(f"Port {port} is filtered or host is down")
    elif response.haslayer(TCP):
        if response[TCP].flags == 0x12:  # SYN-ACK
            print(f"Port {port} is open")
        elif response[TCP].flags == 0x14:  # RST-ACK
            print(f"Port {port} is closed")

# Usage
target_ip = "192.168.1.1"
target_port = 80
syn_scan(target_ip, target_port)
This script uses Scapy to send a TCP SYN packet to a specified IP address and port. It then interprets the response to determine if the port is open, closed, or filtered.
Remember that using such tools on networks or systems you don't own or have explicit permission to test can be illegal. Always ensure you have proper authorization before conducting any security testing. Such tools and programs should be used by authorized systems administrators only.
6. Factory Automation
Python is increasingly used in factory automation due to its versatility, ease of use, and powerful libraries for data analysis, machine learning, and communication with industrial equipment. For instance, Python is used for data collection and analysis from sensors and equipment, process monitoring and control, predictive maintenance, and simulation of factory processes. Key libraries include PyModbus (for communicating with PLCs and other industrial devices using the Modbus protocol) and OpenCV (for computer vision to inspect objects coming up on the assembly line).
Here's a simple example that simulates a factory process and collects data. We can only show simulated data here but if your program is “hooked up” to a real factory you will be analyzing real data!
import time
import random

def simulate_factory_process(num_steps):
    for step in range(num_steps):
        # Simulate a process running in a factory
        temperature = random.uniform(20.0, 100.0)  # Simulate temperature readings
        pressure = random.uniform(1.0, 5.0)  # Simulate pressure readings
        print(f'Step {step + 1}: Temperature={temperature:.2f}C, Pressure={pressure:.2f}bar')
        time.sleep(1)  # Simulate time delay for the process

# Run the simulation for 10 steps
simulate_factory_process(10)
This script simulates a factory process by generating random temperature and pressure readings.
If you run this program, you will get output such as:
Step 1: Temperature=71.15C, Pressure=4.38bar
Step 2: Temperature=71.44C, Pressure=4.68bar
Step 3: Temperature=50.68C, Pressure=4.84bar
Step 4: Temperature=54.85C, Pressure=4.94bar
Step 5: Temperature=67.30C, Pressure=4.86bar
Step 6: Temperature=20.78C, Pressure=3.72bar
Step 7: Temperature=46.53C, Pressure=2.33bar
Step 8: Temperature=31.26C, Pressure=4.06bar
Step 9: Temperature=70.22C, Pressure=3.02bar
Step 10: Temperature=25.20C, Pressure=2.76bar
In a real factory automation scenario, you would replace these random values with actual sensor readings from industrial equipment and proceed to process them in your Python program, e.g., find anomalies or sources of inefficiency that can be mitigated.
As you can see Python is not just a good first programming language to learn, it is likely one of the more advanced languages you can learn due to its penetration into so many industries and sectors of our economy!
Want to learn Python with us? Sign up for 1:1 or small group classes.